
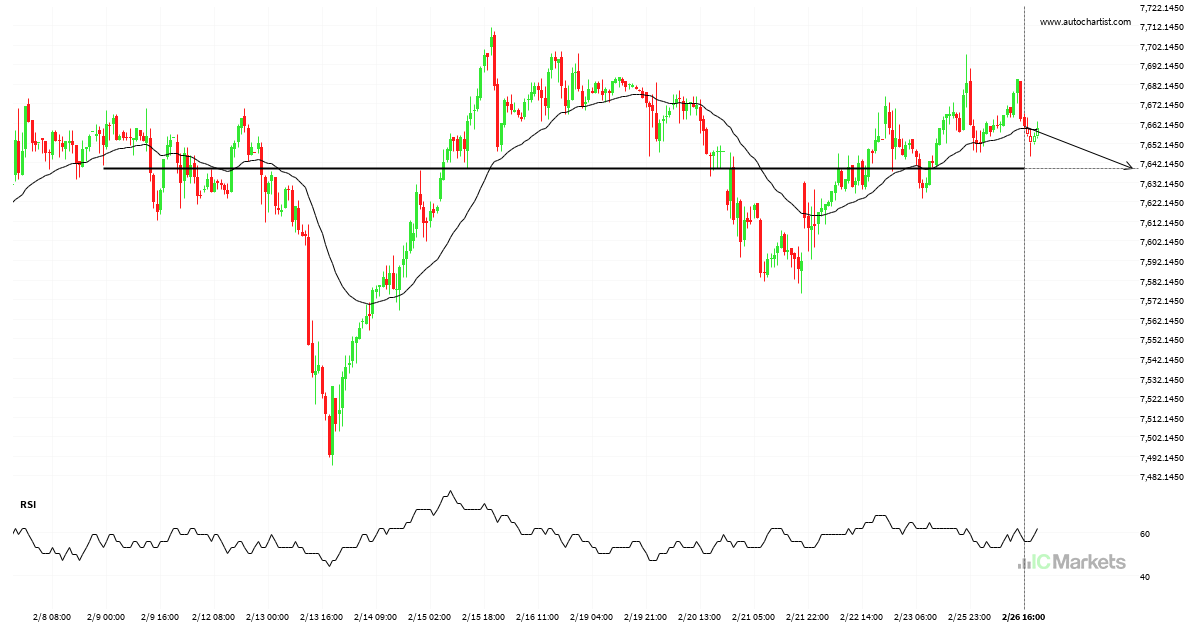
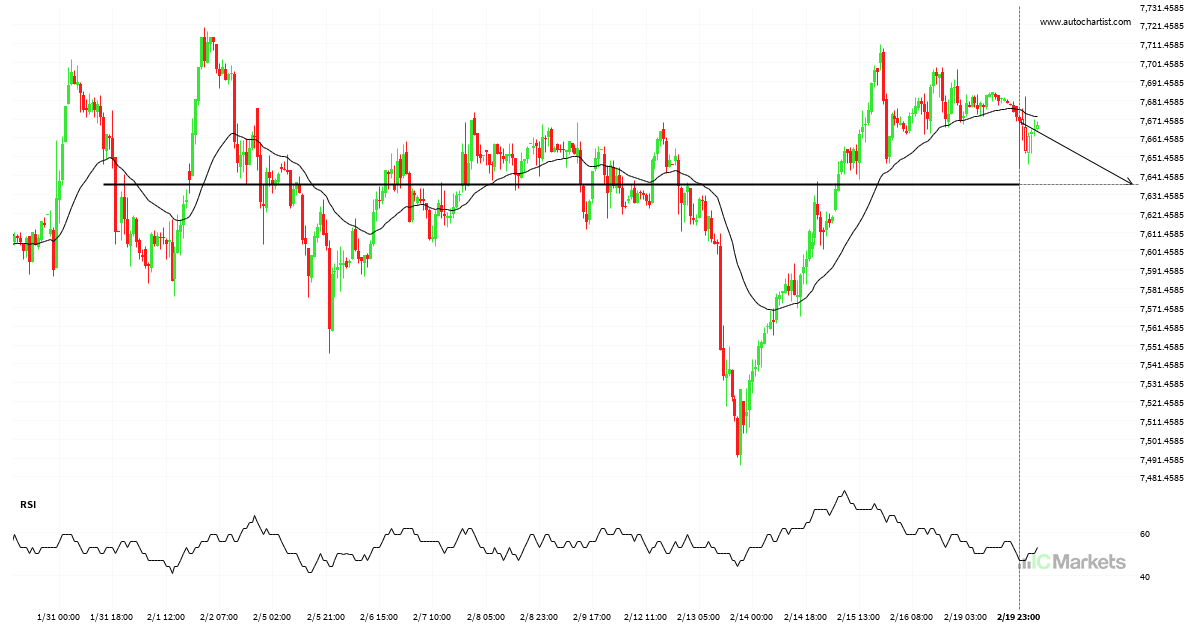
Australia 200 Index is on the approach
Australia 200 Index is heading towards 7639.0898 and could reach this point within the next 3 days. It has tested this line numerous times in the past, and this time could be no different, ending in a rebound instead of a breakout. If the breakout doesn’t happen, we could see a retracement back down to […]
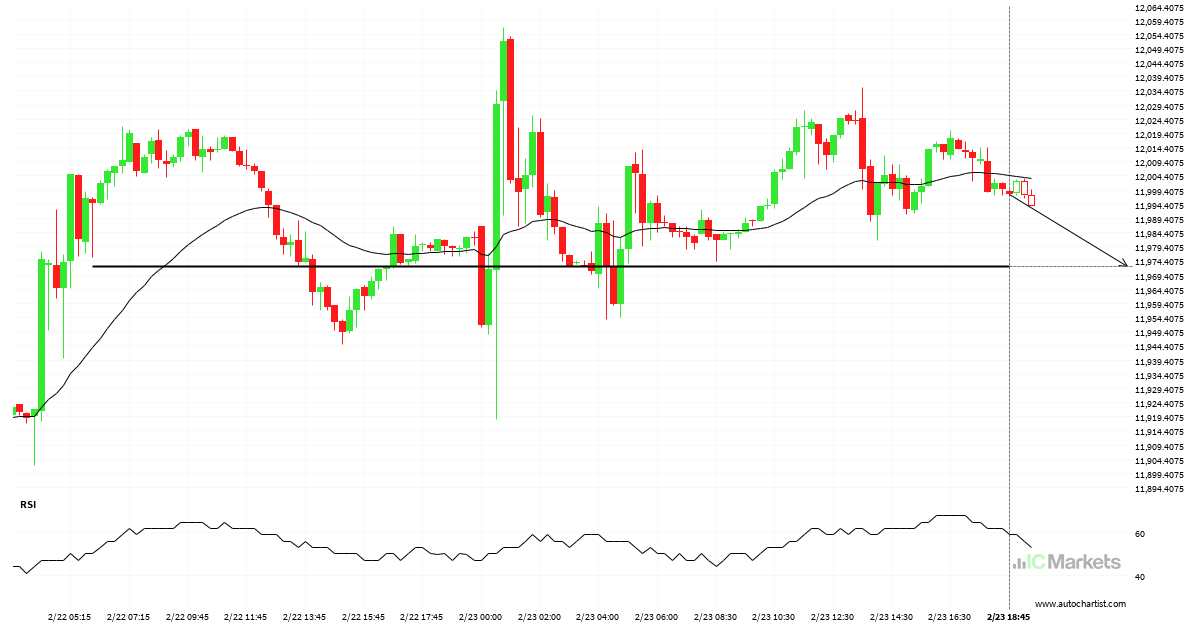
Should we expect a breakout or a rebound on FTSE China A50 Index?
FTSE China A50 Index is about to retest a key horizontal support level near 11972.5898. It has tested this level 4 times in the recent past and could simply bounce off like it did last time. However, after this many tries, maybe it’s ready to start a new trend.
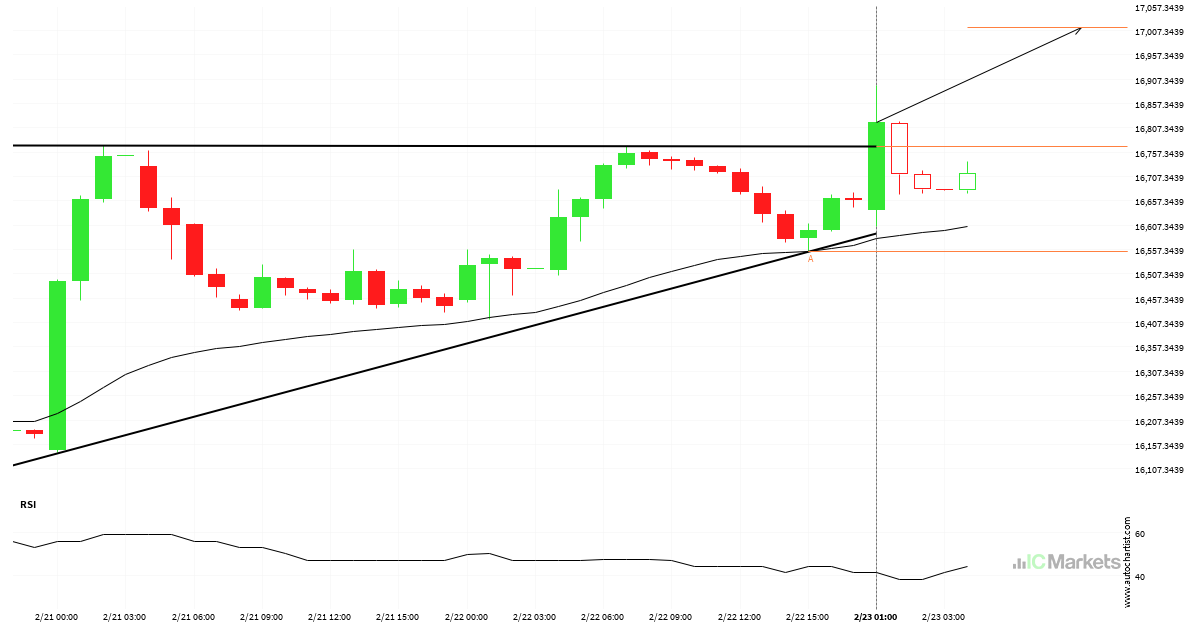
A possible start of a bullish trend on Hong Kong 50 Index
The last 3 1 hour candles on Hong Kong 50 Index formed a Ascending Triangle pattern and broken out through the pattern lines, indicating a possible bullish movement towards the price level of 17012.4556.
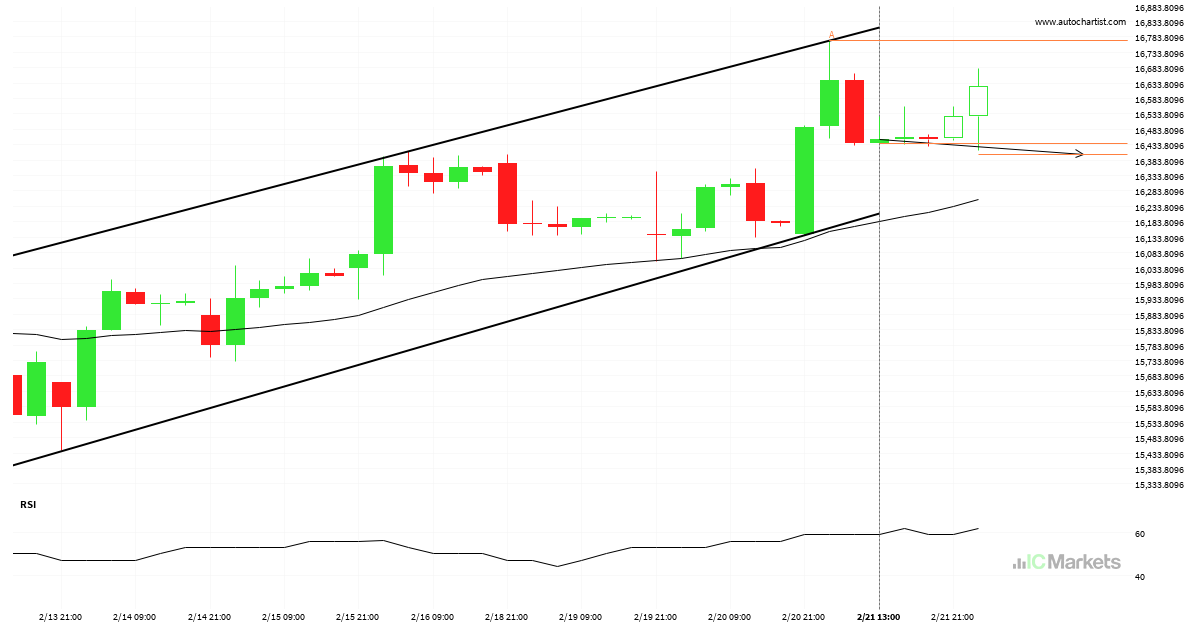
Hong Kong 50 Index approaching support of a Channel Up
The movement of Hong Kong 50 Index towards the support line of a Channel Up is yet another test of the line it reached numerous times in the past. This line test could happen in the next 2 days, but it is uncertain whether it will result in a breakout through this line, or simply […]
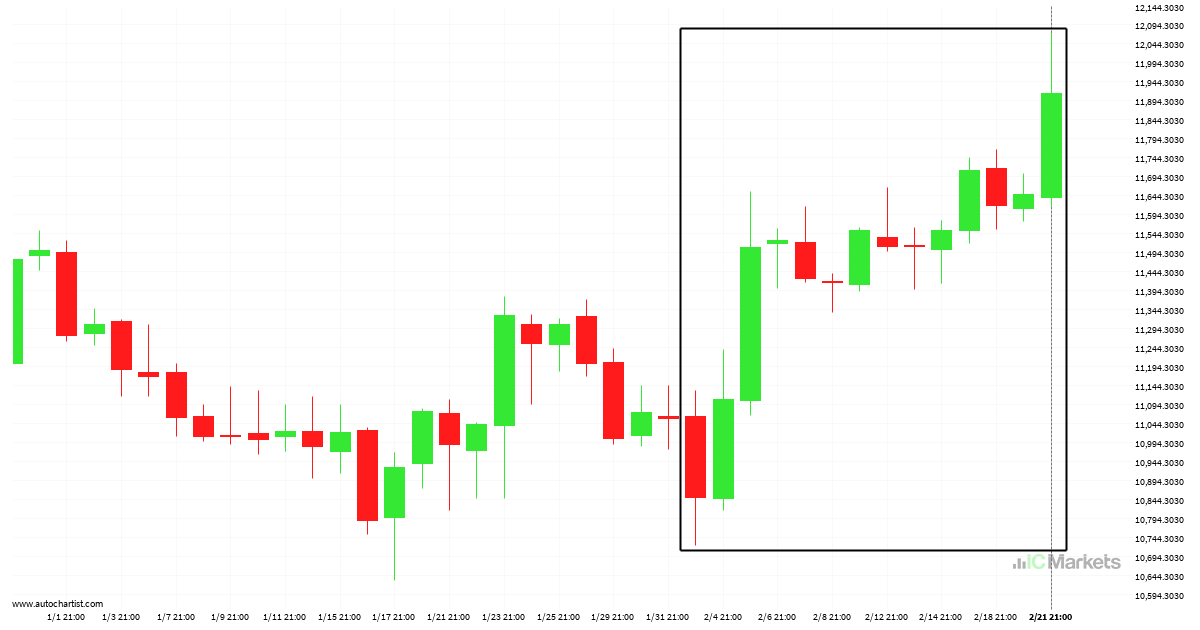
Huge bullish move on FTSE China A50 Index
FTSE China A50 Index has experiened an extremely big movement in last 20 days. It may continue the trend, but this would make the move unprecidented in the recent past.

Hong Kong 50 Index approaching resistance of a Ascending Triangle
A Ascending Triangle pattern was identified on Hong Kong 50 Index at 16265.41, creating an expectation that it may move to the resistance line at 16399.8614. It may break through that line and continue the bullish trend or it may reverse from that line.
Either a rebound or a breakout imminent on Australia 200 Index
Australia 200 Index is moving towards a key support level at 7636.8501. Australia 200 Index has previously tested this level 4 times and on each occasion it has bounced back off this level. Is this finally the time it will break through?
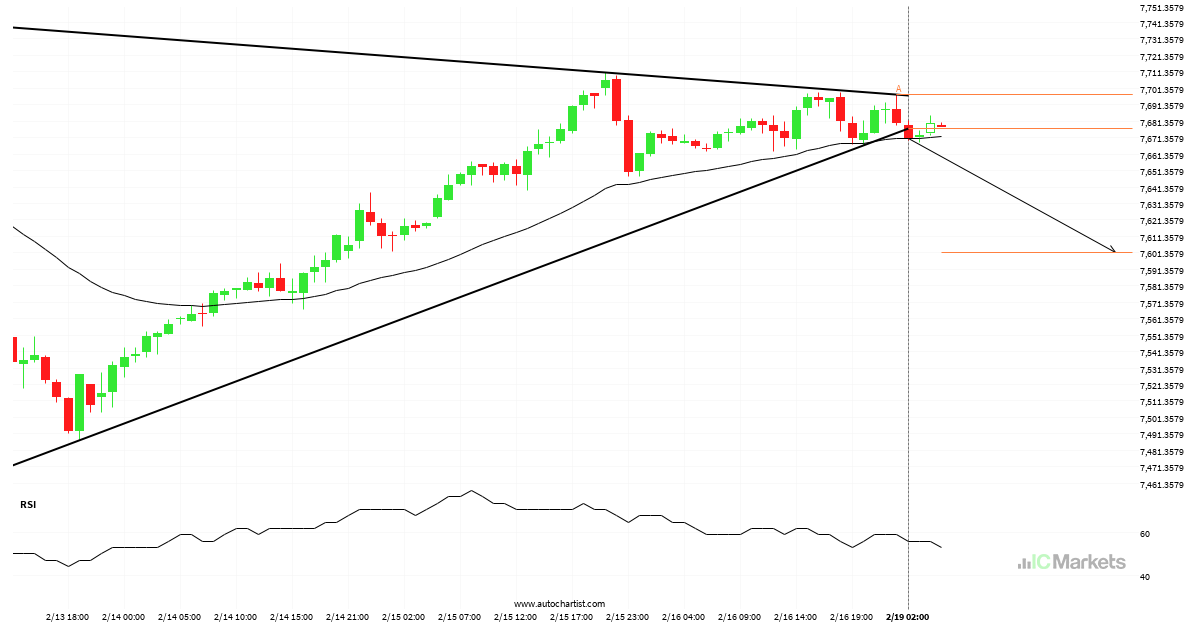
Australia 200 Index – support line broken at 2024-02-19T03:00:00.000Z
Australia 200 Index moved through the support line of a Triangle at 7676.919142857143 on the 1 hour chart. This line has been tested a number of times in the past and this breakout could mean an upcoming change from the current trend. It may continue in its current direction toward 7601.4700.
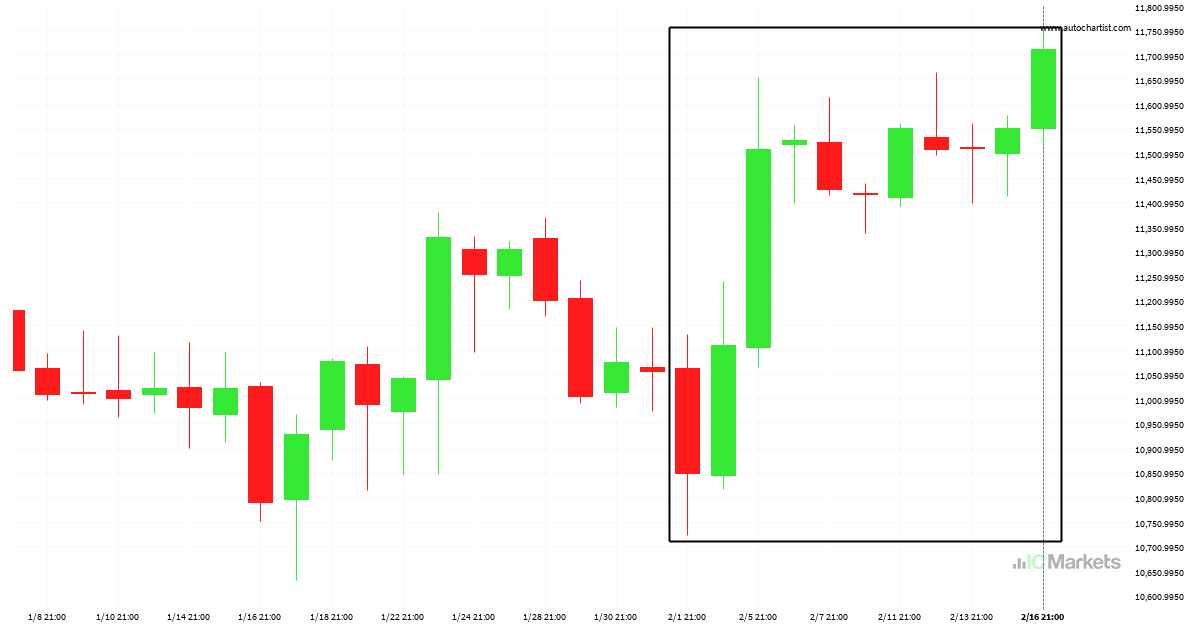
FTSE China A50 Index was on its way up
An unexpected large move has occurred on FTSE China A50 Index Daily chart beginning at 10847.12 and ending at 11711.82. Is this a sign of something new? What can we expect in the future?
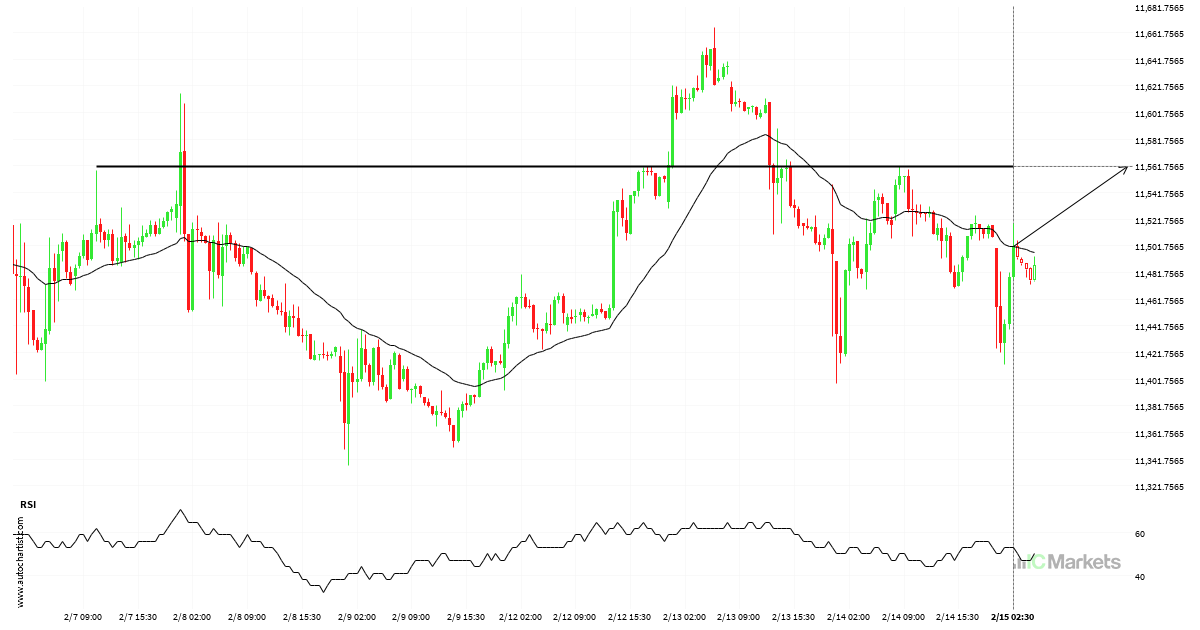
FTSE China A50 Index approaching important level of 11561.6904
FTSE China A50 Index is moving towards a key resistance level at 11561.6904. This is a previously tested level for FTSE China A50 Index. This could be a good trading opportunity, either at the spot price, or after breaching this level.